Interactive Graphs

Interactive Graphs
Hibbs Institute for Business & Economic Research
The Hibbs Institute provides some interactive graphs to help its audience understand regional and historical data. Visualizing some concepts and economic indicators in a very friendly manner, where the user is able to manipulate some of the numbers shown in the graphics.
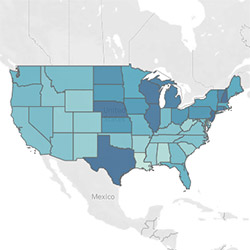 |
U.S. Property Tax Rates by State This graph displays the forty-eight continential states in the U.S. and the District of Columbia, ranked from the highest to lowest by annual property taxes as a percentage of the median home value; |
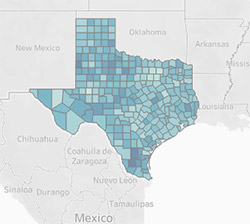 |
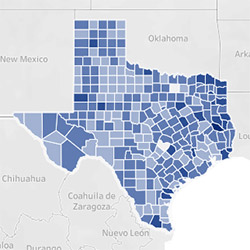
Texas Propery Tax Rates by County This graph displays the 254 counties in Texas, ranked from highest to lowest by annual property tax rate ($) basded on $100.00 of taxable valuation of a property. |
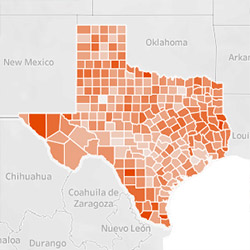 |
This graph shows the Adult Smoking Rates for all counties in the state of Texas. The rate ranges from 11% to 20% (the highest the darker). The graph conveniently illustrates the differences from county to county. |
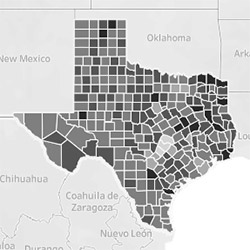 |
This graph shows the Adult Physical Inactivity Rates for all counties in the state of Texas. The rate ranges from 16% to 35% (the highest the darker). The graph conveniently illustrates the differences from county to county. |
 |
This graph shows the Adult Obesity Rates for all counties in the state of Texas. The rate ranges from 21% to 40% (the highest the darker). The graph conveniently illustrates the differences from county to county. |