Hibbs Newsletter
View PDF Version
Health Status in East Texas — January 2026
This issue of the Hibbs Newsletter updates and expands the 2019 publication Health Status in the U.S., with a Focus on East Texas (July 2019). It incorporates additional metrics and the most recent available data to present an updated overview of health status in the United States, with particular emphasis on health outcomes in East Texas.
Health outcomes are a core indicator of population health, reflecting both longevity and quality of life. Accordingly, this issue focuses on two widely used measures: life expectancy at birth (LEB) and mortality rates, with particular attention to recent trends in the United States and East Texas.
Life expectancy at birth measures the average number of years a newborn is expected to live, assuming current mortality patterns continue. In the United States, LEB has risen to 78.4 years, making a recovery from the declines observed during the COVID-19 pandemic when life expectancy fell to 77.0 years. This rebound represents a notable improvement in population health over the past three years.
According to the U.S. Centers for Disease Control and Prevention (CDC), the 0.9-year increase in life expectancy in 2023 was driven primarily by a decline in COVID-19 mortality, which accounted for 51.9% of the overall improvement. Additional gains were achieved through lower mortality rates associated with heart disease (13.1%), cancer (3.5%) and diabetes (3.3%). These gains were partially offset by rising mortality from nutritional deficiencies, meningococcal infection, Parkinson’s disease, whooping cough and malaria, which constrained the overall increase in life expectancy (CDC, 2025).
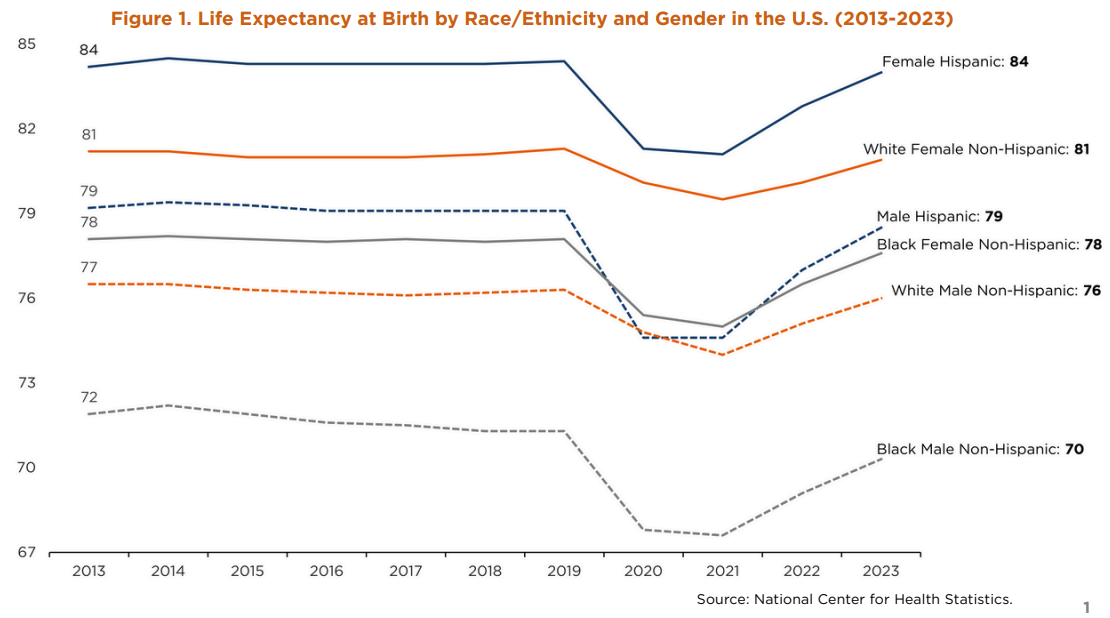
Life expectancy at birth also varies substantially across demographic groups. Factors such as gender, race and ethnicity play an important role in shaping health outcomes. Females consistently have higher life expectancy than males, and Hispanic populations generally outlive non-Hispanic White and Black populations. Figure 1 illustrates these differences in life expectancy across demographic groups.
Mortality rates are a second key measure of health outcomes, capturing the number of deaths within a population, typically reported per 100,000 people. These rates can be calculated for specific demographic groups — such as age, gender or race — or for particular causes of death. Mortality is commonly reported using two measures: crude mortality rates, which reflect the total number of deaths in a population, and age-adjusted mortality rates, which account for differences in age composition and allow for more accurate comparisons across regions and over time. Together, these measures help identify patterns in disease burden and populations facing elevated health risks.
According to the National Vital Statistics Report, the United States recorded 3,090,964 deaths in 2023. Figure 2 presents the percentage distribution of deaths across the 10 leading causes, which together accounted for 70.9% of all deaths nationwide. Heart disease and cancer remained the two leading causes of death, jointly representing 42% of total deaths and continuing a long-standing trend (NVSS, 2025).
Between 2022 and 2023, deaths declined for nearly all leading causes. COVID-19-related deaths decreased sharply, falling by 73%. Additional decreases were observed for diabetes (5.9%), Alzheimer’s disease (5.1%), liver disease (4.7%), kidney disease (4.6%), heart disease (3.1%), unintentional injuries (1.9%), stroke (1.7%) and chronic lower respiratory diseases (1.4%). Cancer was the only leading cause of death to increase, rising by 0.8%, from 608,371 deaths in 2022 to 613,352 deaths in 2023.
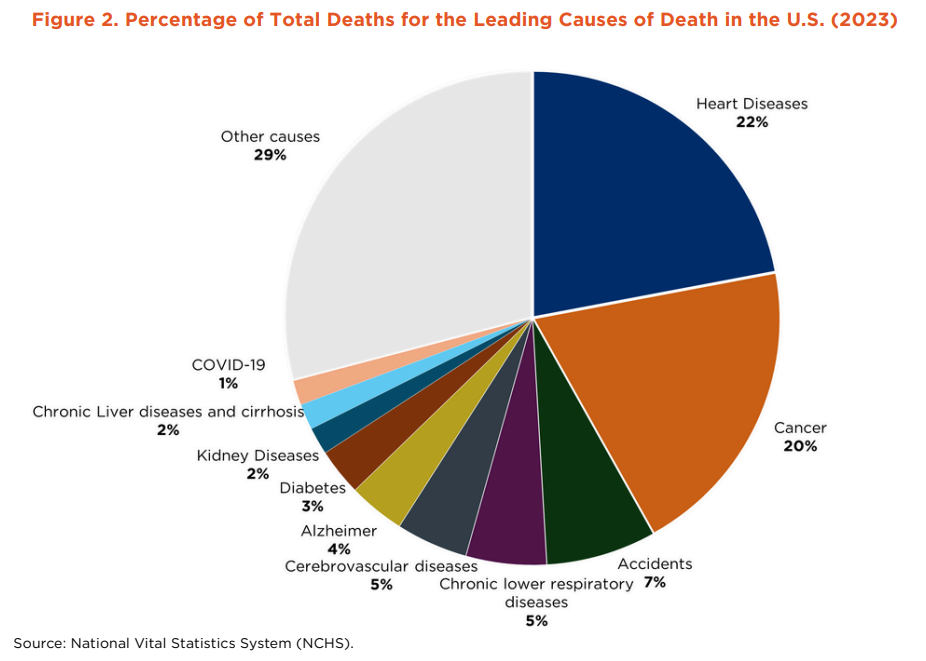
Figure 3 compares life expectancy at birth (LEB) in East Texas and statewide in 2019 by gender. In East Texas, life expectancy at birth was 75.8 years, below the state average. In East Texas, life expectancy was lower for both males (73.1 vs 76.5) and females (78.7 vs 81.5). Overall, life expectancy at birth in Texas was 79.0 years in 2019.
Table 1 presents life expectancy at birth (LEB) across the 23 counties of East Texas, revealing
substantial variation within the region. Smith County records the highest life expectancy
across all
population groups, with 75.5 years for males, 80.6 years for females and 78.1 years
for the total population. In contrast, Anderson County exhibits the lowest life expectancy
values among East Texas counties with 71.1 years for males, 77.2 years for females
and 73.6 years for the total county population.
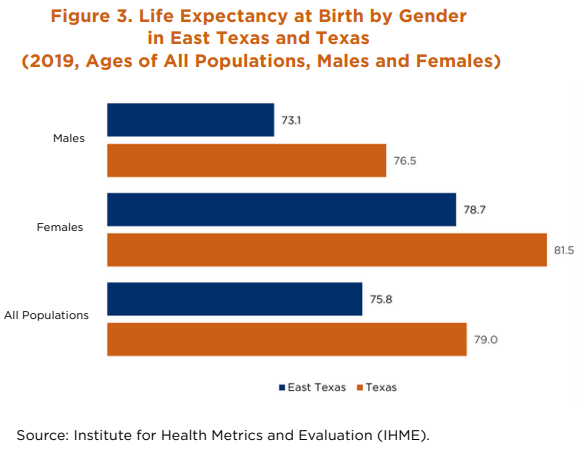
Table 1. Life Expectancy at Birth in East Texas by County
(Ages of All Populations, Males and Females)
| County | All | Male | Female |
|---|---|---|---|
| Anderson | 73.6 | 71.1 | 77.2 |
| Bowie | 75.4 | 72.8 | 78.1 |
| Cass | 75.5 | 72.6 | 78.3 |
| Camp | 75.4 | 72.5 | 78.4 |
| Cherokee | 76.3 | 74.2 | 78.6 |
| Delta | 75.7 | 72.8 | 79.1 |
| Franklin | 78.0 | 75.6 | 80.6 |
| Gregg | 75.4 | 72.7 | 78.1 |
| Harrison | 76.4 | 73.5 | 79.4 |
| Henderson | 75.4 | 72.5 | 78.5 |
| Hopkins | 76.4 | 73.7 | 79.2 |
| Lamar | 75.1 | 72.5 | 77.7 |
| Marion | 74.2 | 71.0 | 77.7 |
| Morris | 74.2 | 70.8 | 77.7 |
| Panola | 75.6 | 73.1 | 78.3 |
| Rains | 76.8 | 74.0 | 79.8 |
| Red River | 74.4 | 71.3 | 77.6 |
| Rusk | 76.7 | 74.5 | 79.1 |
| Smith | 78.1 | 75.5 | 80.6 |
| Titus | 76.6 | 74.4 | 78.8 |
| Upshur | 75.6 | 73.0 | 78.3 |
| Van Zandt | 76.6 | 73.7 | 79.4 |
| Wood | 76.3 | 73.6 | 79.3 |
| Average | 75.8 | 73.1 | 78.7 |
Source: Institute for Health Metrics and Evaluation (IHME)
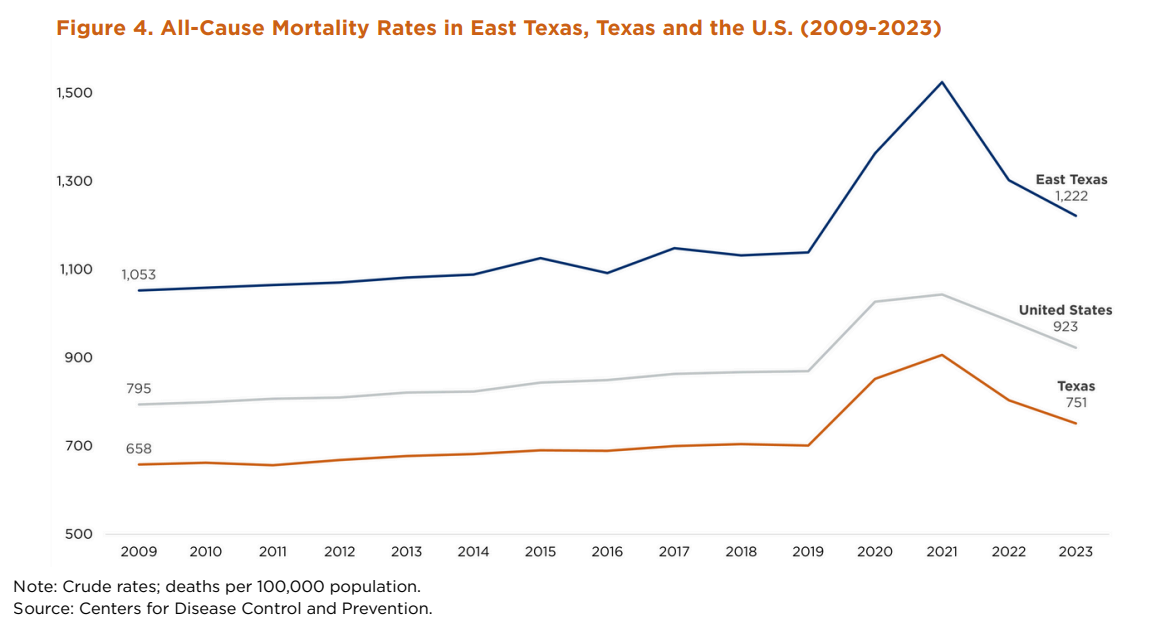
Figure 4 presents the all-cause crude mortality rate for East Texas, Texas and the United States. In 2023, East Texas recorded the highest mortality rate, with 1,222 deaths per 100,000 population, compared to 751 deaths per 100,000 in Texas and 923 deaths per 100,000 nationwide.
Mortality rates across all three geographies peaked during the COVID-19 pandemic in 2021. That year, East Texas reached 1,524 deaths per 100,000 population, while Texas and the United States recorded 906 and 1,044 deaths per 100,000 population, respectively. Since then, mortality rates have declined across all regions, though levels in East Texas remain elevated relative to state and national averages.
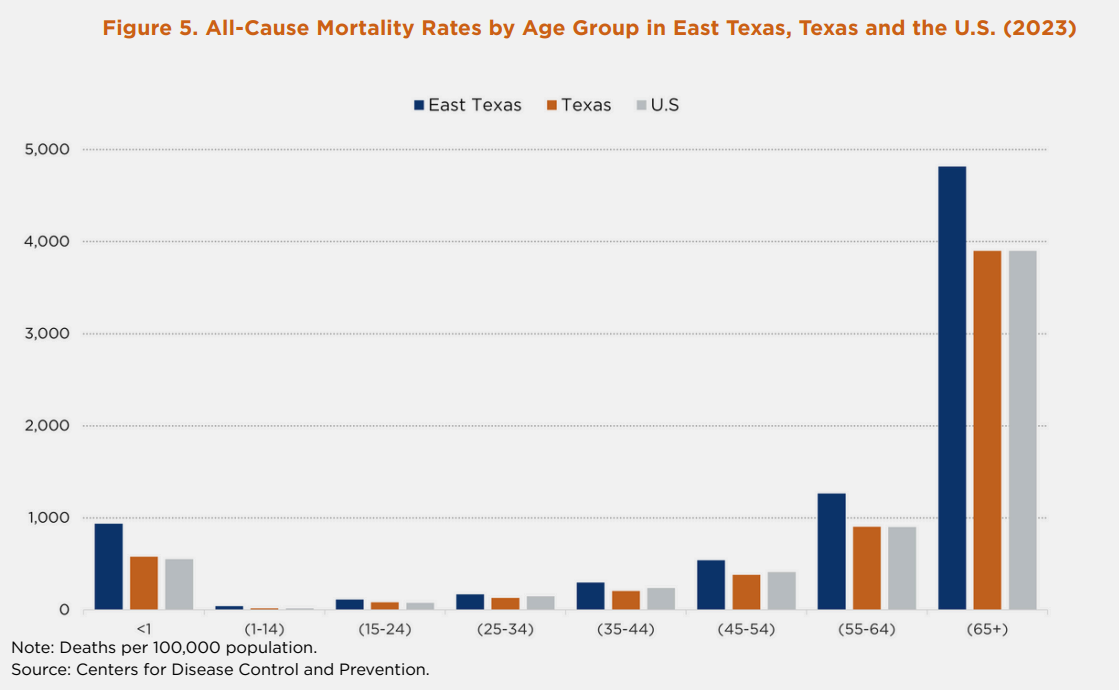
Differences in mortality are also evident across age groups. As shown in Figure 5, East Texas consistently exhibits higher mortality rates than both Texas and the United States at nearly every age. Mortality rises sharply beginning in the 55–64 age group, with the largest disparities observed among individuals aged 65 and older.
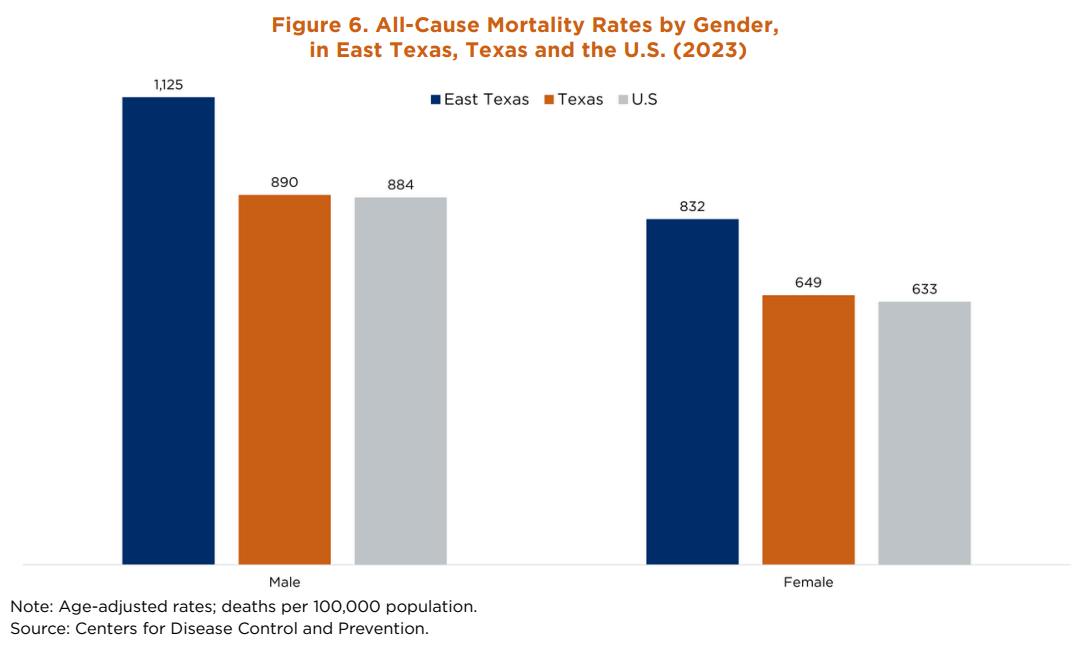
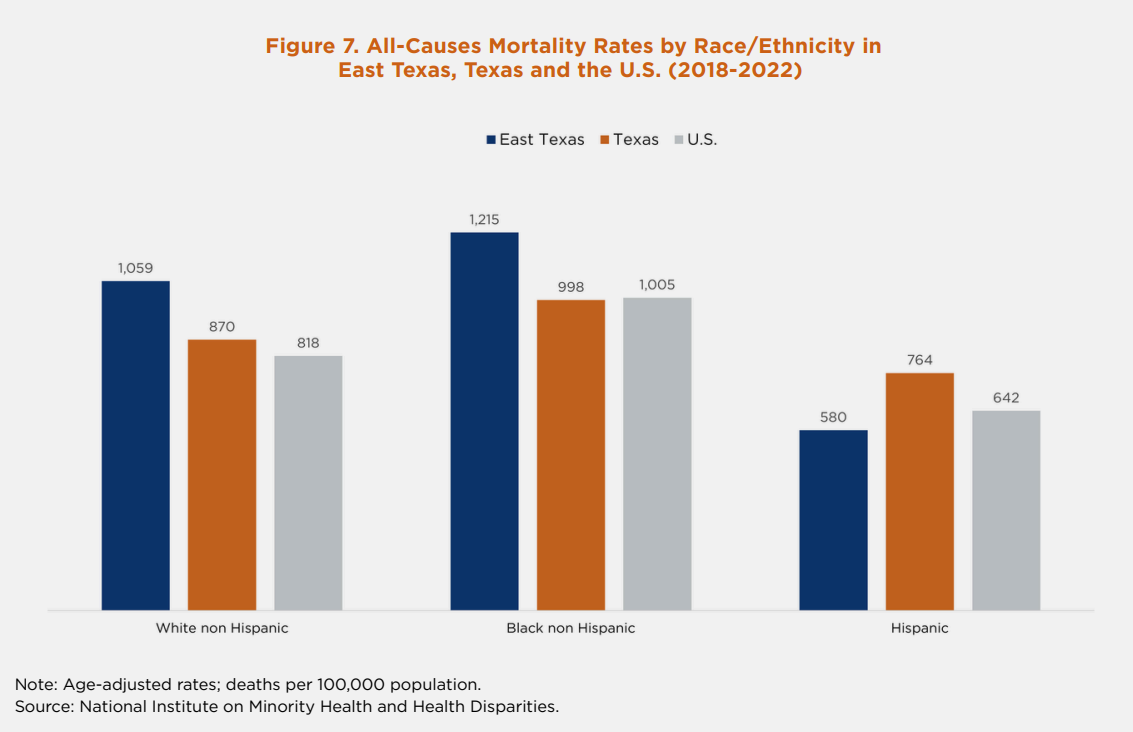
Differences in mortality rates between East Texas, Texas and the United States persist across most demographic subgroups. As shown in Figures 6 and 7, East Texas consistently records higher mortality rates than the state for both males and females, as well as for non-Hispanic White and non-Hispanic Black populations.
Specifically, mortality rates in East Texas are 26.4% higher for males and 28.2% higher for females compared with those in Texas. Among racial and ethnic groups, mortality rates are 21.7% higher for both non-Hispanic White and non-Hispanic Black populations. In contrast, Hispanic populations in East Texas exhibit lower mortality, with rates 24% below the statewide rate.
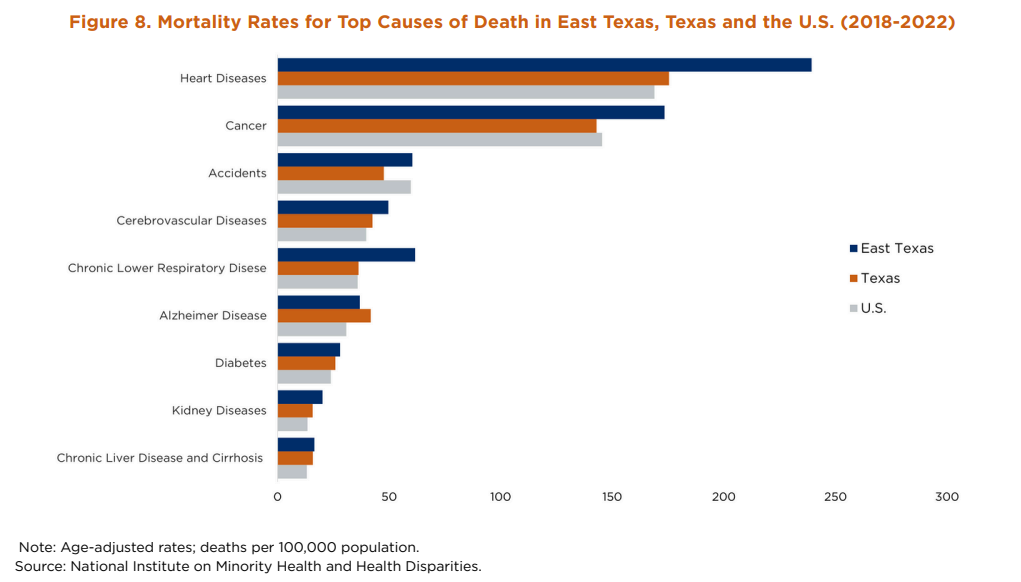
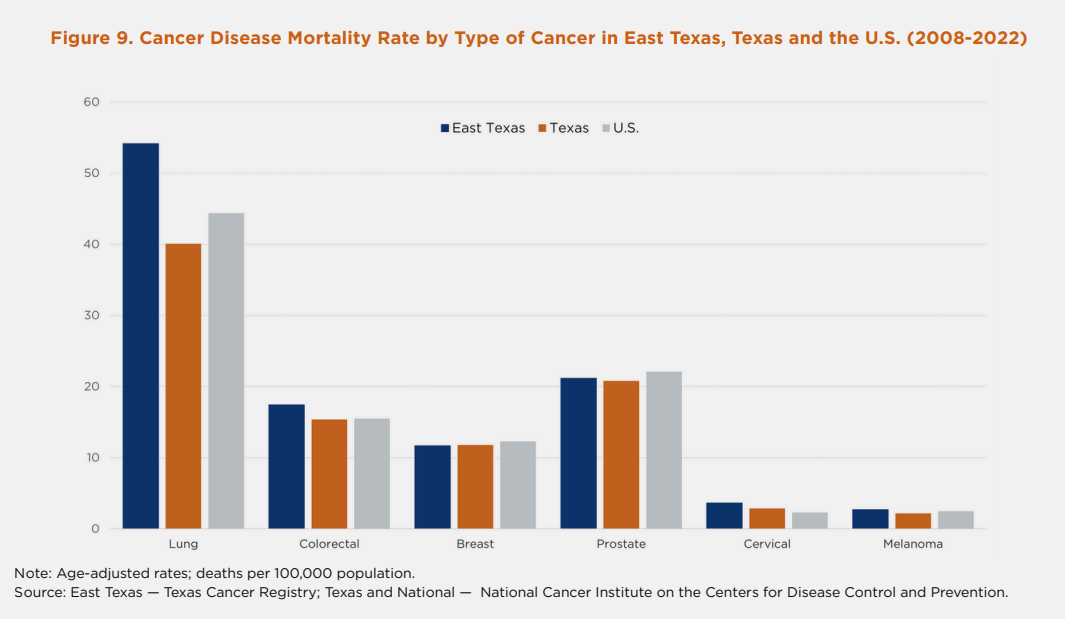
Between 2018 and 2022, East Texas recorded higher mortality rates than both Texas and the United States for several leading causes of death. As shown in Figure 8, mortality from heart disease (239 deaths per 100,000 population), cancer (173 deaths per 100,000) and chronic lower respiratory disease (62 deaths per 100,000) are substantially higher in East Texas relative to statewide and national averages. Similar patterns are observed across other major causes included in the figure.
Cause-specific cancer mortality also reveals persistent disparities. As illustrated in Figure 9, lung cancer shows the largest gap, with mortality rates in East Texas 35% higher than the Texas average and 22% higher than the national rate.
Figures 10–12 compare crude mortality rates for leading causes of death in the Tyler MSA, Texas
and the United States from 2009 to 2023. Over this period, mortality rates in Tyler
consistently
exceeded those in Texas and are often comparable to or higher than national levels.
Heart disease mortality in Tyler increased by 32% since 2019, reaching 280 deaths
per 100,000
population in 2023, well above the rates in Texas (164) and the United States (203).
Cancer mortality in Tyler also remains higher than the state average, though it declined
from 196 in 2019
to 178 in 2023. For chronic lower respiratory disease, mortality declined slightly
in Texas and nationwide in 2023 while Tyler experienced an increase, widening the
gap to more than 20 deaths
per 100,000 population above the state rate.
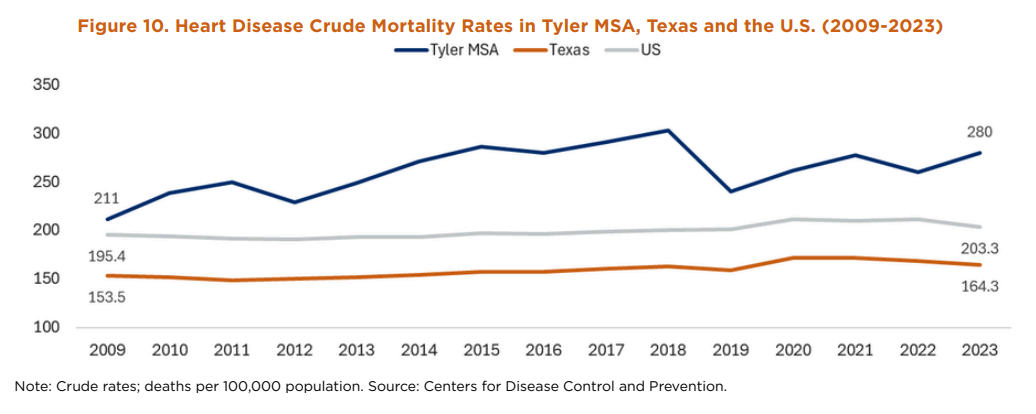
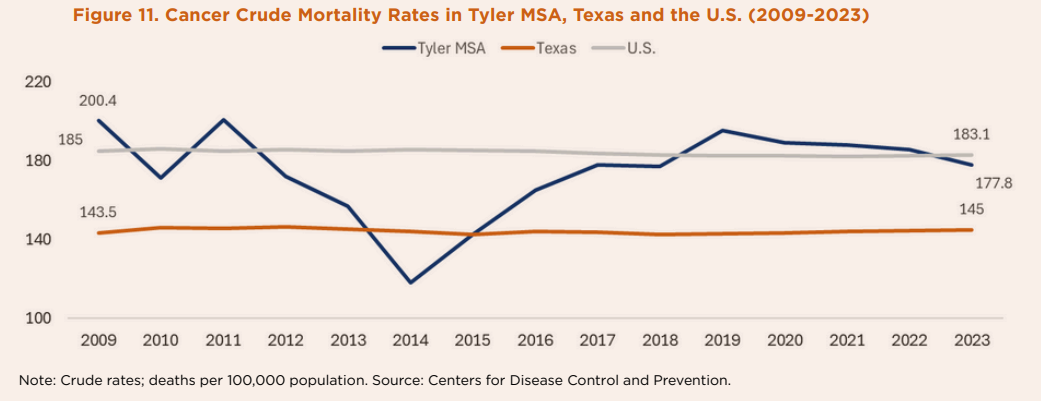
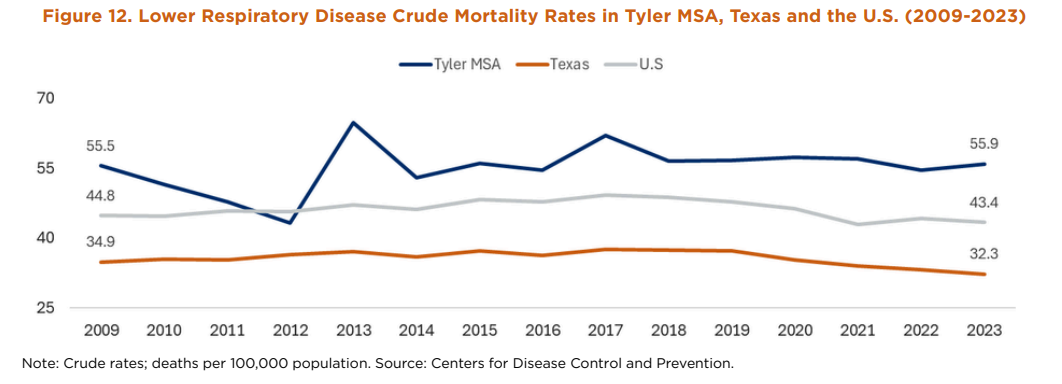
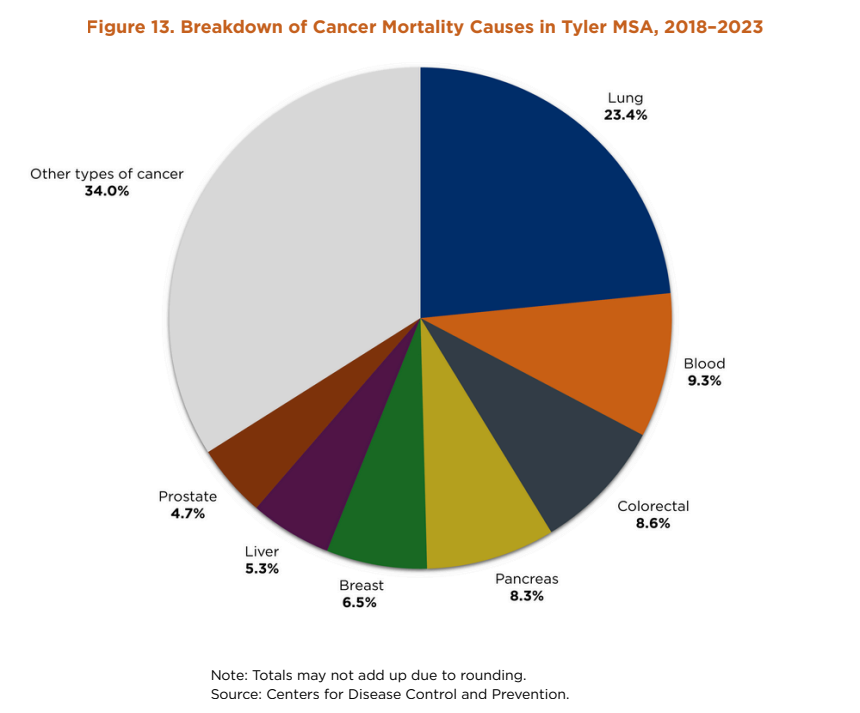
Figure 13 displays the 7 leading cancer types in the Tyler MSA from 2018 to 2023. Over this
period, the region recorded 2,886 cancer-related deaths. Lung cancer accounted for
the largest share of cancer mortality, with 23.4% of all cancer deaths. Other major
contributors include blood cancers (9.3%), colorectal cancers (8.6%) and pancreatic
cancer (8.3%). Additional cancer types include
breast (6.5%), liver (5.3%) and prostate (4.7%). Less common cancer types together
accounted for the remaining 34% of cancer-related deaths.
Figures 14–16 compare crude mortality rates for leading causes of death in the Longview MSA, Texas and the United States from 2009 to 2023. Across all three causes, Longview consistently records higher mortality rates than both the state and the nation.
Heart disease mortality in Longview increased from 252.6 deaths per 100,000 population in 2009 to 271.6 in 2023, remaining above Texas and U.S. levels throughout the period. Cancer mortality also rose from 204.1 to 208.9 deaths per 100,000, exceeding the Texas rate (145.0) and staying above the national average (183.1) in 2023. The largest increase occurred in lower respiratory disease mortality, which rose by 31%, from 65.7 deaths per 100,000 population in 2009 to 86.3 in 2023. Over the same period, mortality rates for this cause declined slightly in both Texas and the United States.
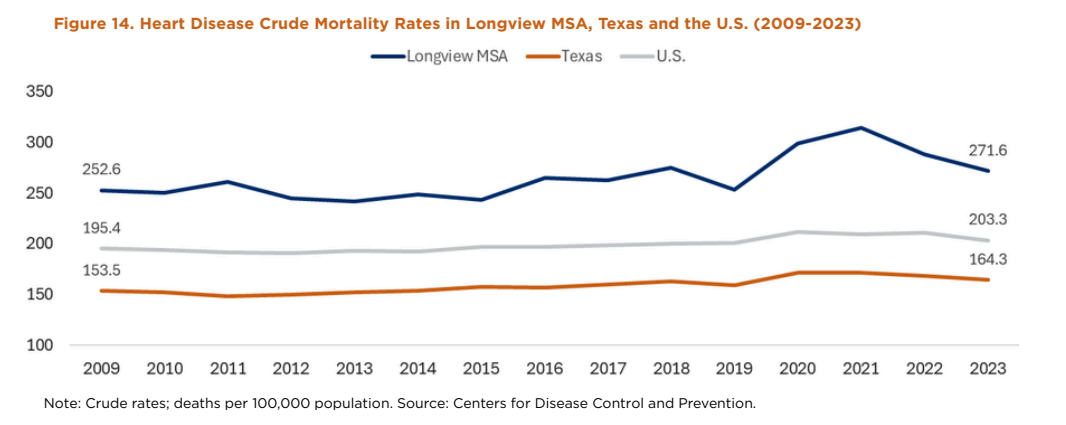
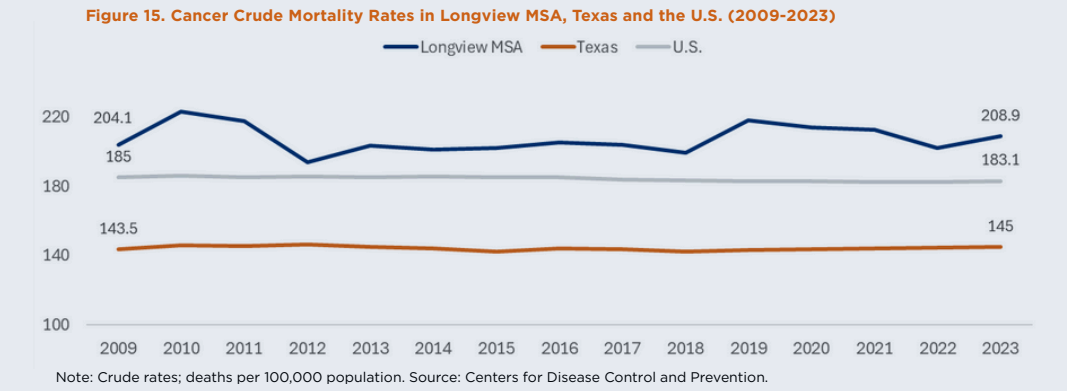
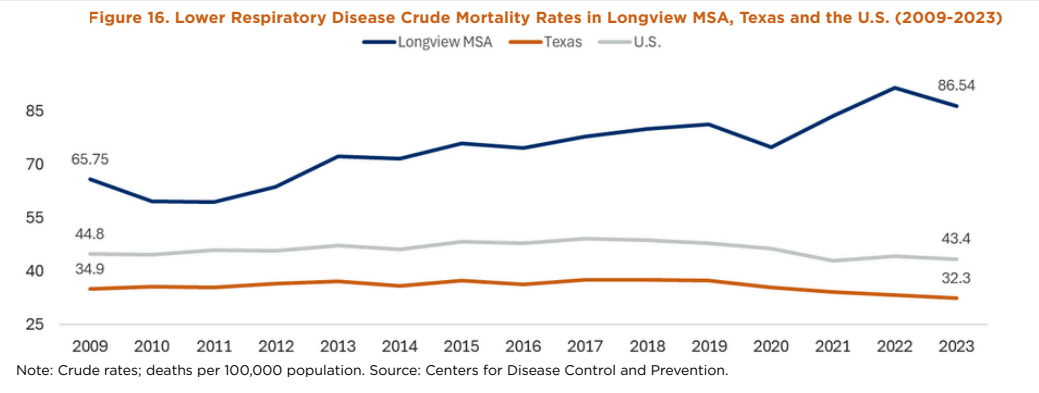
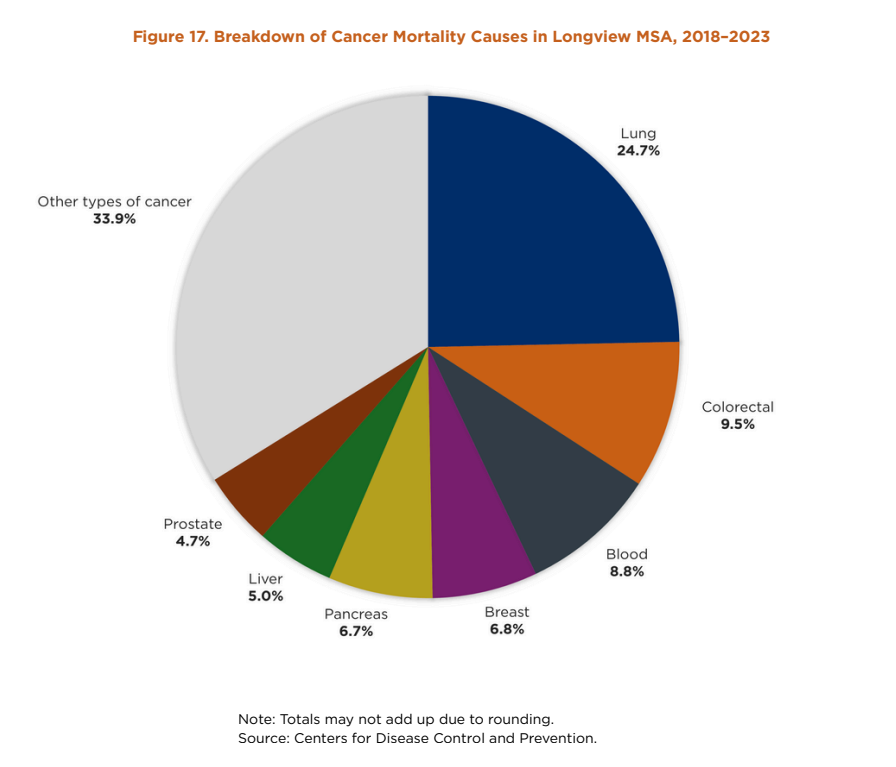
Figure 17 displays the seven leading cancer types in the Longview MSA from 2018 to 2023. Over this period, the region recorded 3,952 cancer-related deaths.
Lung cancer accounted for the largest share of cancer mortality, representing 24.7% of all cancer deaths. Other major contributors include colorectal cancers (9.5%), blood cancers (8.8%) and breast cancers (6.8%). Additional cancer types include pancreatic (6.7%), liver (5.0%) and prostate (4.7%). Less common cancer types together accounted for the remaining 33.9% of cancer-related deaths.
Figures 18-20 compare crude mortality rates for leading causes of death in the Texarkana MSA, Texas and the United States. Across all three causes, mortality rates in Texarkana remain substantially higher than both state and national levels.
Heart disease mortality in Texarkana more than doubled the Texas rate in 2023 and
increased by roughly 100 deaths per 100,000 population since 2009. Cancer mortality
also remains elevated, reaching 263 deaths per 100,000 population, compared with 183
nationwide and 145 in Texas. A
similar pattern is observed for lower respiratory disease mortality. In 2023, Texarkana
recorded 94 deaths per 100,000 population, more than twice the national rate and nearly
three times the Texas rate.
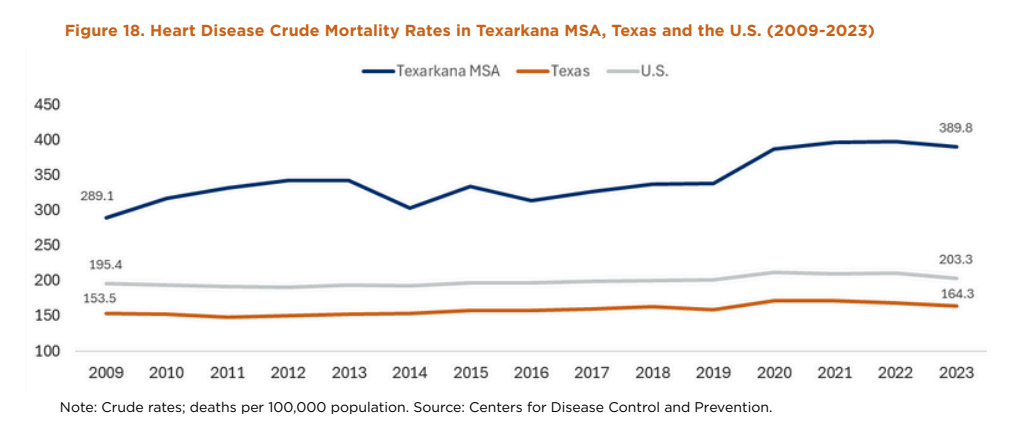
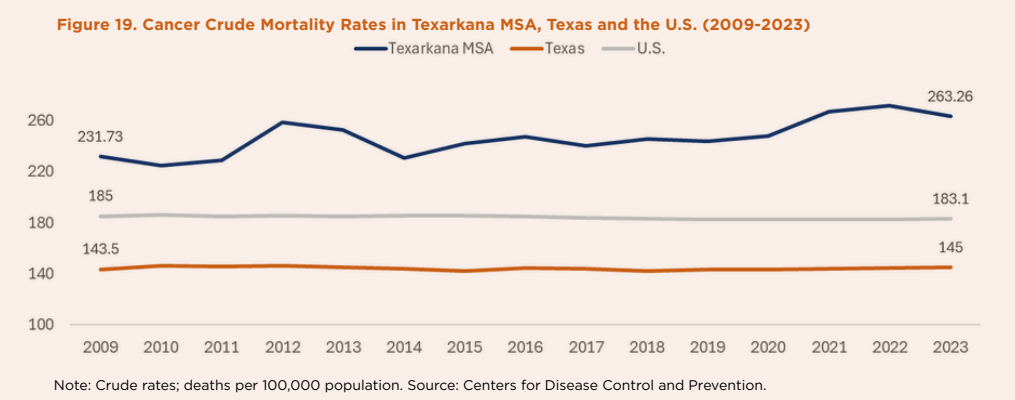
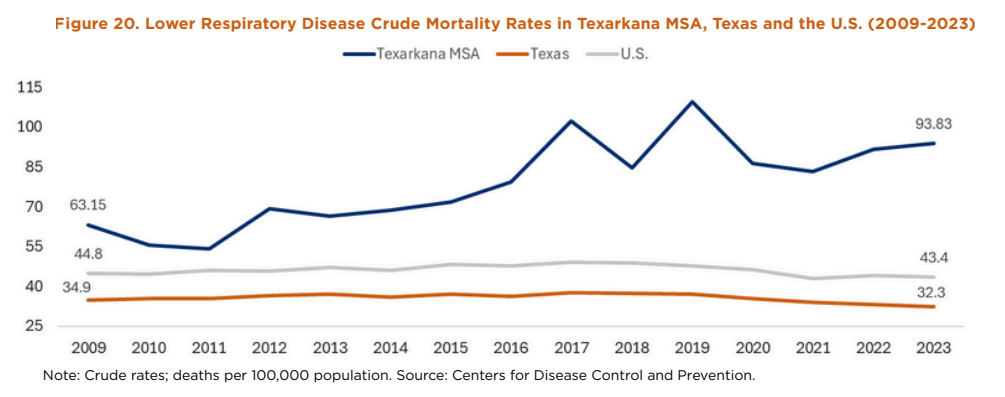
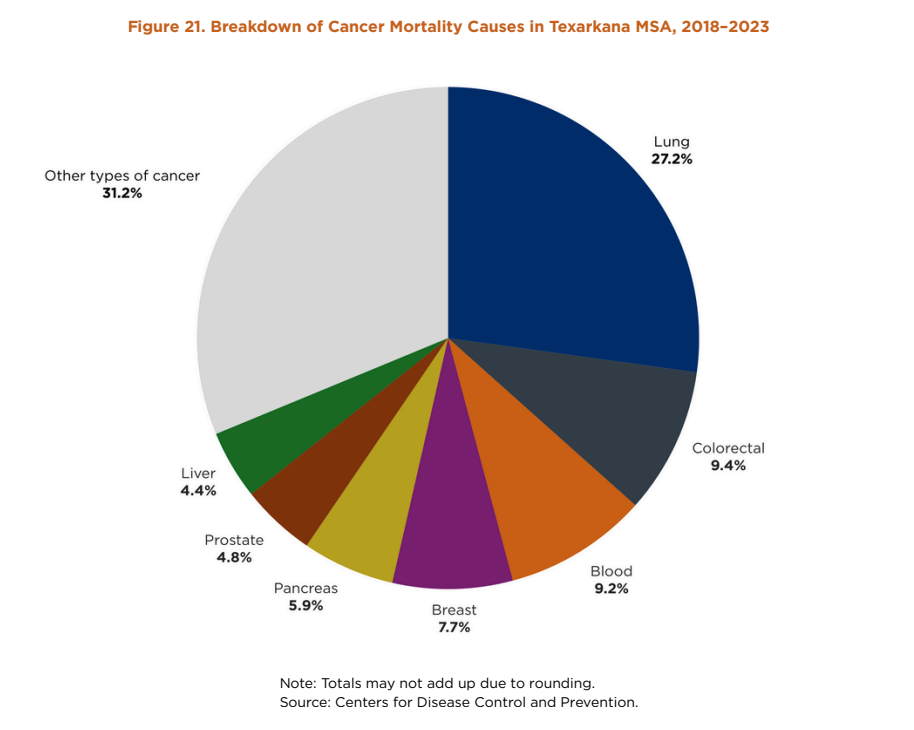
Figure 21 displays the 10 most common cancer types in the Texarkana MSA from 2018 to 2023. Over this period, the region recorded 3,183 cancer-related deaths.
Lung cancer accounted for the largest share of cancer mortality with 27.2%. Other major contributors include colorectal cancers (9.4%), blood cancers (9.2%) and breast cancers (7.7%). Additional cancer types include pancreatic (5.9%), prostate (4.8%) and liver (4.4%). Less common cancer types together accounted for the remaining 31.2% of cancer deaths.
![]()
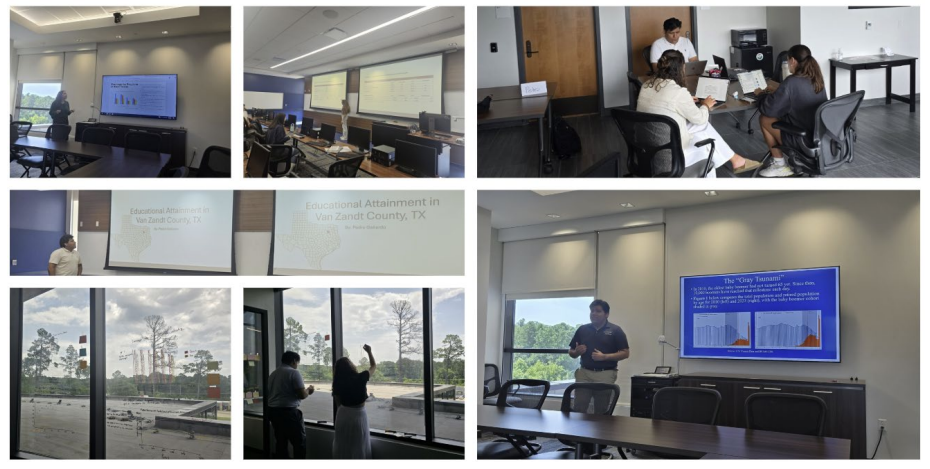
In fall 2024, the Hibbs Institute for Business and Economic Research launched the Hibbs Institute Internship Program - an intentional investment in cultivating the next generation of regional researchers and leaders. The program provides undergraduate students with hands-on experience in economic analysis, allowing them to engage with real-world data and contribute to applied research focused on East Texas.
One of the program's first participants, Luisa Moraes, played a key role in this project. Reflecting on her experience, she shared:
"I am very happy to contribute to this report and help bring attention to the health status of East Texas. Health plays a vital role in economic outcomes, and measuring both progress and ongoing challenges over time can provide valuable insights to strengthen the labor force and promote economic development across the region."
Luisa's experience reflects the broader mission of the Hibbs Internship Program and the importance of applied research in understanding regional challenges. As East Texas continues to grow, improving health outcomes remains closely tied to workforce stability, productivity and long-term economic development. Tracking these indicators over time helps identify both progress and persistent gaps, informing efforts to strengthen the region's economic future for all communities.
HIBBS INSTITUTE STAFF
Cecilia Cuellar, Ph.D.
Marilyn Young, Ph.D.
Luisa Moraes
hibbsinstitute@uttyler.edu
903.565.5952